400-900-9767
当前位置:首页 > 雅思频道 > 雅思写作 > 支招雅思小作文 | 混合数据图 澳大利亚的医生数量
发布时间:2023-07-07 关键词:雅思小作文
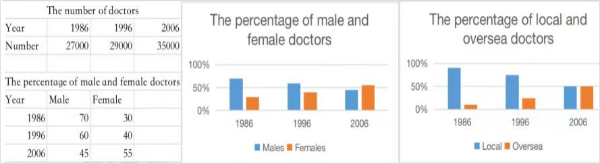
摘要:The table and charts below show the number of doctors and percentages of different groups of doctors in Australia from 1986 to 2006.
[2023/ 7/ 1] The table and charts below show the number of doctors and percentages of different groups of doctors in Australia from 1986 to 2006.
【主体段分段】:表格和个柱图信息交叉,可以合并
Body 1:表+柱图1
Body 2:第2个柱图
【开头段】
The table and bar charts present the number of doctors in Australia and changes in the proportions of domestic and overseas doctors in this country between 1986 and 2006.
【概述段】
Overall, the given period witnessed a rising trend in the total number of doctors. Also, 2006 was the year when the gender difference and the gap between local and non-local doctors were the smallest.
思路要点:
- 总人数上升
- 2006年男女&本国、外国医生的人数差距--都
【Body 1】
We can see that there emerged a marginal rise in the total number of doctors from 27000 in 1986 to 29000 in 1996, followed by a remarkable growth to its highest point at 35000 in 2006. Among them, the percentage of male doctors saw a noticeable decline from 70% to 45%. However, although only 30% of the doctors were females in the beginning, this figure nearly doubled and overtook the figure for their male counterparts in the final year.
**语言点提示:
- 关联性表达
- 交点描述
思路要点:
- 总人数小幅度上升→急剧上升
- males:显著下降
- females:一开始30%,2006年几乎翻倍,超过males
【Body 2】
It is also clear that originally, almost 98% of the doctors were from Australia, but the following years underwent a significant drop in this figure by roughly 50% in 2006. Oppositely, although there were merely 2% of non-local doctors in the initial year, a jump could be found to the same figure as that for domestic doctors in the last year.
思路要点:
- local:年98%→显著下降
- overseas:年2%→剧烈增长→2006年达到和local相同数值(交点)