400-900-9767
当前位置:首页 > 雅思频道 > 雅思写作 > 支招雅思小作文 I 混合数据图 两个城市房价 & 租房、买房人数比例
发布时间:2023-12-01 关键词:雅思小作文
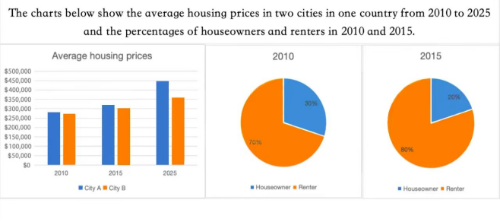
摘要:The charts below show the average housing prices in two cities in one country from 2010 to 2015 and the percentage of house owners and renters in 2010 and 2015. .
[2023/ 11/ 25] The charts below show the average housing prices in two cities in one country from 2010 to 2015 and the percentage of house owners and renters in 2010 and 2015. .
【主体段分段】:按照图分段
Body 1:柱状图
Body 2:两个饼状图
【开头段】
The bar chart compares two cities in terms of their average property prices, and the pie charts suggest changes in the figures for householders and tenants in 2010 and 2015.
【概述段】
It is clear that for both 2010 and 2015, houses in City A were more expensive than those in City B, and this pattern is projected to continue in 2025. We can also find that the majority of surveyed people did not have houses of their own both in 2010 and 2015.
思路要点:
- City A的房价始终>City B的房价
- house renters的比例始终>owners的比例
【Body 1】
From the bar chart, it is noticeable that on average, people in City A had to pay $280,000 for a house in the initial year, and this figure was slightly higher than the housing price in City B($270,000). Subsequently, there emerged a slight rise in the former figure to approximately $330,000 in 2015, before rising dramatically to the highest point at $450,000 in 2025. Likewise, the following years is expected to witness a marginal growth in the prices of real estate in City B by around $7000 in 2025.
思路要点:柱状图
- 2010年的平均房价:City A轻微>City B
- 接下来,City A:到2015轻微上升→到2025将会急剧上升
- City B:一直到2025将会轻微上升
【Body 2】
In terms of types of residents, we can see that 70% of them rented a house in 2010, and 5 years later, this figure climbed significantly by 10%. Conversely, although there were 30% of the surveyed people who owned a house in the beginning year, a remarkable drop could be found in this figure to only 20% in 2015.
思路要点:饼图
- 橙色 renter:2010年占比70%→2015年显著上升
- 蓝色house owner:2010年占比30%→2015年显著下降