400-900-9767
400-900-9767
当前位置:首页 > 雅思频道 > 雅思写作 > 支招雅思小作文I 混合数据图 澳洲游客数量变化
发布时间:2023-12-15 关键词:雅思小作文
摘要:The chart and graph below show the number of tourists from three countries to Australia and two kinds of tourists between 1995 and 2005
[2023/ 12/ 9] The chart and graph below show the number of tourists from three countries to Australia and two kinds of tourists between 1995 and 2005
【主体段分段】:一图一段
【开头段】
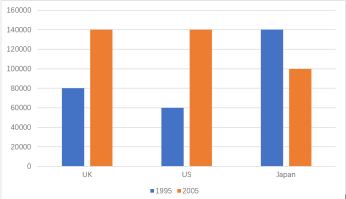
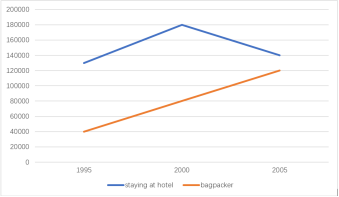
The bar chart reveals how many tourists from UK, US and Japan visited Australia from 1995 to 2005, and the line graph compares two ways of spending holiday among tourists in the same period.
【概述段】
It is clear that more Japanese tourists chose to visit Australia in the initial year, but Australia was more appealing to visitors from UK and USA in 2005. Also, compared with backpackers, more people decided to stay at a resort throughout the given period.
思路要点:
- 柱状图:年Japan游客最多,第二年UK和US的游客数量更多
- 线图:蓝色>橙色
【Body 1】
Looking at the bar chart in more detail, we can see that although 140000 Japanese people traveled to Australia in the beginning year, this figure saw a slight decline by 40000 in the year 2005. By contrast, an opposite pattern could be found in the number of tourists from the other two countries. Originally, the number of travelers from US was the smallest(only 60000), in contrast to the figure for British visitors(80000). The subsequent decade witnessed a surge in these two figures to 140000, an increase of 6000 and 8000 respectively.
思路要点:柱状图
- Japan:1995年→1995年小幅度下降
- US和UK:相反趋势
- 1995年:US(60000),UK游客数量为8000
- 2005年:两者都剧增到140000,分别上涨了6000和8000
【Body 2】
From the line graph, it is noticeable that staying at hotel was an ideal way of spending vocation among roughly 130000 of the surveyed tourists in 1995. In the subsequent 5 years, a remarkable climb to the peak at 180000 could be found in this figure, before falling constantly by 40000 in the final year. However, there were only 40000 backpackers in the original year. Afterwards, this figured tripled until 2005.
思路要点:线图
- 蓝色:1995年有130000人→随后5年,显著上升到峰值→随后持续下降
- 橙色:年只有40000→随后上涨了三倍