当前位置:首页 > 雅思频道 > 雅思写作 > 雅思小作文 | 头大!没完没了的 bar chart~~
发布时间:2019-10-23 关键词:
摘要:
今天的主题是柱图,提供一篇范文,供同学们参考!
9月7日雅思小作文真题
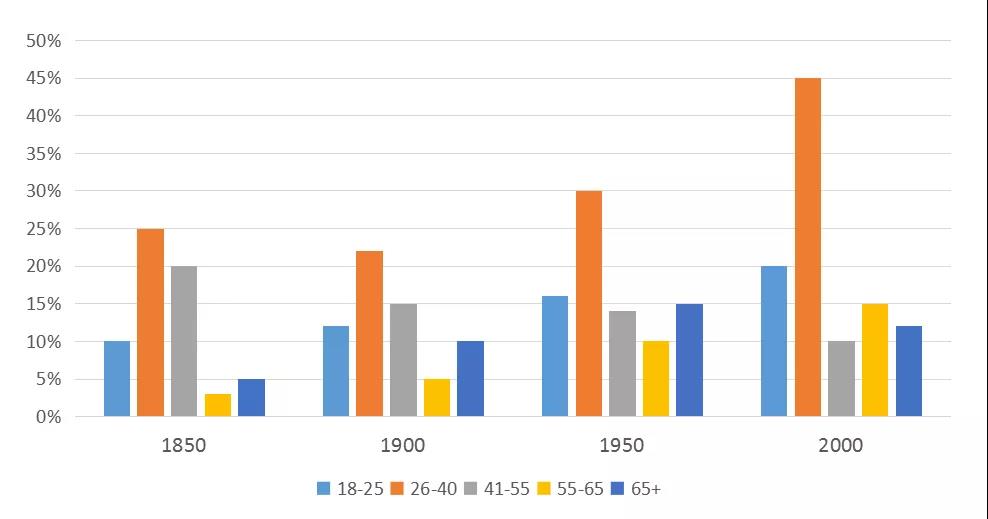
The chart below shows percentages of people living by their own in five age groups in the UK between 1850 and 2000.
Summarise the information by selecting and reporting the main features, and make comparisons where relevant.

范文及解析
虽然题目中的陈述是between 1850 and 2000,但是并不是线性概念,所以考核的是比较概念。
题目考核两个比较概念:1)年份之间的比较,即“同项不同时”;2)age group之间的比较,“同时不同项”。
The four groups of bars are the illustrations of the percentage of UK people living a solitary life in the four years of 1850, 1900, 1950, and 2000, and they are divided into five groups. ←不把题目中三个堆叠的介词短语重复,而是拆开。
总结行文结构:从宏观到微观
Among the five age groups, two – the 26-40 group and the 55-65 group – ←故意设计成同位语的形式来丰富语法现象 stood out, 不要急着把句子停下来,后接(原因)状语从句,设计复合句: since the maximum (45 percent) and the minimum (approx. 3 percent) were in the two groups. It is also notable that the 26-40 group were more likely to live independently in the four years than the other groups. ←不要机械描述数据,而是陈述数据所体现出来的事实 The opposite was the case ←依托前文建立出来的语境来简化写作内容 with the 55-65 group except in the year of 2000.
要敢于“舍”,笼统描述没有特点的数值
The other three groups – the youngest group, the oldest group and the 41-55 group – did not have stark features. The four years witnessed a gradual growth in the percentage of people living alone in the youngest group and a slow downtrend in the 41-55 group. In addition, the oldest group's mere 5 percent in the year of 1850 was also noteworthy.
敢于笼统描述图表的总特征
Overall, in each of the four years, the likelihood of living alone varied from one age group to another, ←对应age group之间的比较,“同时不同项” and the morerecent two years differ markedly from the two distant early years. ←对应年份之间的比较,即“同项不同时”

