当前位置:首页 > 雅思频道 > 雅思写作 > 雅思写作 |线图 臭氧水平变化
发布时间:2022-12-02 关键词:雅思写作
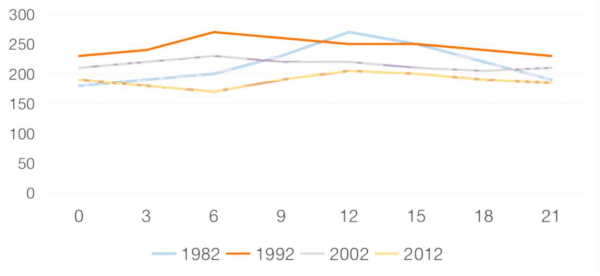
摘要:The graph below shows the level of the ozone (microgram) in four different years during a particular day from 0 to 21 o’clock.

The graph below shows the level of the ozone (microgram) in four different years during a particular day from 0 to 21 o’clock.
数据图:【线图】
主要关注【变化】+不能忽视【对比】
【首段】简述图表大致内容
Shown in the graph is the changing level of the ozone from 0 to 21 o’clock on a specific day. Four separate years, 1982, 1992, 2002 and 2012, are investigated.
首句[倒装],动词使用细节[主谓一致]
句子主语【同位语成分】
【主体段1】首先,描述变化相对较大的两条线-1982 & 1992
Enormous changes could be found in 1982 and 1992. To specify, both two years witnessed a growing trend before 6 o’clock, with the level rising to 200 micrograms and 270 micrograms respectively. Afterwards, although there was an opposite trend, they had both dropped to the original level by 21 o’clock.
程度修饰词的使用
独立主格结构的使用
【主体段2】然后,关注到变化程度相对小一些的两条线-2002 & 2012
By contrast, in 2002 and 2012, both ozone levels were within a narrow range. Before 12 o’clock, an enormously different situation was found in these two years, whose levels ranged from 200 micrograms to 225 micrograms and from 175 micrograms to 200 micrograms respectively. Then, both figures stabilized until 21 o’clock, when the gap between them maintained the initial level.
段落之间的衔接词
程度修饰词
描述趋势的动词
定语从句
【结尾】
To sum up, this day saw varying changes in the ozone level in the four separate years.
varying adj. 不同的

