400-900-9767
400-900-9767
当前位置:首页 > 雅思频道 > 雅思写作 > 支招雅思小作文 I 线图 澳洲5种行业员工比例
发布时间:2024-07-12 关键词:雅思小作文
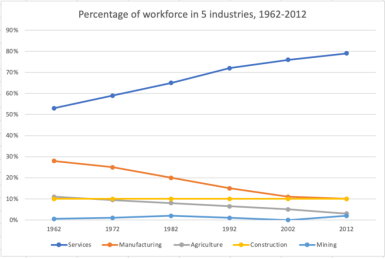
摘要:The graph below shows the percentage of Australian workforce in five industries between 1962 and 2012.
The graph below shows the percentage of Australian workforce in five industries between 1962 and 2012.
【主体段分段】:
Body 1:Services(上升趋势),
Manufacturing,Agriculture(下降趋势)
Body 2:Construction(平稳),Mining(轻微波动)
【开头段】
The line graph compares 5 industries in Australia with regard to the proportion of employees from 1962 to 2012.
【概述段】
Overall, service sector attracted the highest number of workers throughout the given period, but it also witnessed the largest decrease in popularity.
思路要点:
Services数值始终,变化幅度
【Body 1】
Looking at the information in more detail, we can see that throughout the 5 decades, service industry topped the list concerning the percentage of workforce, with the figure jumping from 52% in 1962 to 80% in 2012. By contrast, a sharp drop was found in the figure for people working in manufacturing sector from 29% to 10% in the first 40 years, followed by a period of steadiness until 2012. Similarly, the proportion of agricultural workforce also experienced a constant decline, falling from 11% to 2% between 1962 and 2012.
思路要点:Services(上升趋势);Manufacturing,Agriculture(下降趋势)
- Services(深蓝色):数值始终,1962年为52%→到2012年急剧上升到80%
- Manufacturing(橙色):1962年为29%→显著下降到2002年10%→到2012年平稳
- Agriculture(灰色):1962年为11%→小幅度下降到2012年2%
【Body 2】
In the other two sectors, the figures for workforce experienced no significant changes. Specifically, only 10% of the surveyed people found a job in construction in the initial year, and this figure kept steady until the end of the given period. Mining was the least popular field among employees. Originally, no people chose to work in this industry. Subsequently, there was a period of fluctuations, with the figure reaching no more than 2% in the next 6 decades.
思路要点:Construction(平稳),Mining(轻微波动)
- Construction(黄色):数值平稳在10%
- Mining(浅蓝色):1962-2012年内在0和2%之间波动
新航道-用心用情用力做教育!
400-900-9767