400-900-9767
400-900-9767
当前位置:首页 > 雅思频道 > 雅思写作 > 支招雅思小作文 I 动态线图 不同年龄段参观博物馆
发布时间:2025-01-07 关键词:雅思小作文
摘要:The graph below shows the percentage of people visiting museum once a month or more between 1980 and 2010.
The graph below shows the percentage of people visiting museum once a month or more between 1980 and 2010.
分段方法:
Body 1:18-25(蓝色)、26-45(橙色)
Body 2:46-65(黄色)、65+(绿色)
开头段
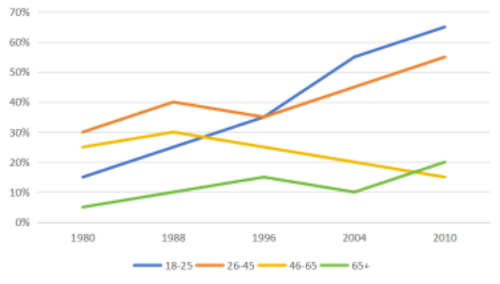
The line graph illustrates changes in the proportion of people from five age groups who went to museums at least once a month between1980 and 2010.
概述段
Overall, all age groups saw an increase in museum visits over the period, except for those aged 46-65. The most significant growth was observed among the youngest age group
思路要点:
- 除了46-65之外,其他年龄段的人数比例都呈现上升趋势
- 18-25岁人数比例涨幅
Body paragraph 1
Initially, 30% of people in the age bracket of 26-to-45 visited museums, the highest proportion among all groups. This figure rose steadily to 40% by 1988, before falling slightly by 5% over the next eight years. However, the final 14 years saw a sharp increase to 55%. Similarly,the percentage of young people(18-25) soared from only 15% in 1980 to almost 70% in 2010, overtaking the figure for those aged 26-45 in 1996.
思路要点:18-25(蓝色)、26-45(橙色)
- 橙色:1980年四个年龄组里(30%)→随后显著上升到1988年的40%→1996年小幅度下降了5%→2010年显著上升到55%
- 蓝色:1980的15%急剧上升到2010的70%。其中在1996年超过橙色
Body paragraph 2
In contrast, the proportion of museum visitors over 46 years old remained relatively low throughout the period. Specifically, a marginal rise from 25% in 1980 to a peak of 30% in 1988 could be found in the 46-65-year-olds, after which there was a remarkable drop by 15% in the final year. Likewise, the figure for the oldest age group tripled to 30% in the beginning 16 years, followed by a modest drop to 10% in 2004. Afterwards, this figure surpassed the percentage of people aged 46 to 65 and doubled in 2010.
思路要点:46-65(黄色)、65+(绿色)
- 其余两个年龄组数据较小
- 黄色:1980年25%小幅度上升到1988年峰值30%→到2010年显著下降了15%
- 绿色:1980年到1996年上升了3倍达到30%→2004年小幅度下降到10%→随后在超过黄色数据,于2010年翻倍。
新航道-用心用情用力做教育!
400-892-8866