当前位置:首页 > 雅思频道 > 雅思写作 > 雅思写作:流程图 3: 生命循环
发布时间:2021-11-22 关键词:雅思写作
摘要:主要描述:这个线图比较特殊,主要看到【比较】,当然有【变化】,只不过老章的思路是不以线性变化为主。表格自然是【比较】。
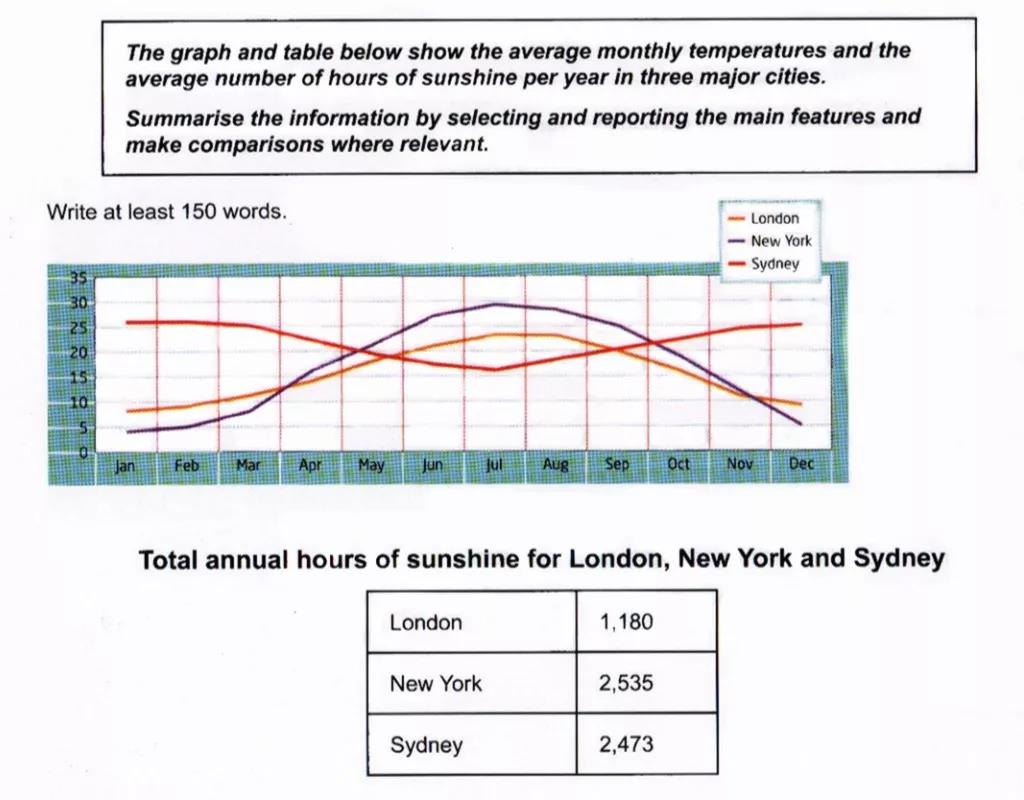
数据图:【线图】+【表格】
主要描述:这个线图比较特殊,主要看到【比较】,当然有【变化】,只不过老章的思路是不以线性变化为主。表格自然是【比较】。
【时间点单一】,同在一个固定年份内,只有城市之间的比较,没有时间之间的比较。这种“同时间不同城市之间的比较”的情况,老章归纳出来的模型为“同时不同项”。
# Introduction

Shown in the line graph and the table are three cities’ average monthly temperatures (in Celsius) and their average annual lengths of sunshine (in hours).
* 老生常谈之划线部分是倒装现象。
* 如果在【introduction】不写对于整个图表情况的总述,那么就需要写【conclusion】。
# Body
According to the line graph, the contrast between the Northern Hemisphere cities and the Southern Hemisphere city is marked. 由第 一句话可以看出,老章的思路不是【变化】而是比较,北半球的两个城市VS南半球的一个城市。New York and London, as they both are in the northern half of the globe, are similar, and a year starts and ends with the lowest temperature of 10 degrees. The highest temperatures occur in the middle of the year – June, July and August, and July is the hottest month in both cities, and it is noteworthy that New York’s July has warmer than London’s by 7 degrees. Clearly, the rest of the months saw either climbing or falling temperatures. 至此可以看出老章这里对于【变化】的描述,并没有教条的按照“从开头到结尾”的顺序来写。而是先写两端的低点,再写中间的高点,最后写低点和高点之间温度变化的趋势。In Sydney, the opposite is the case.短小一句是提醒读者,接下来老章呀写位于南半球的悉尼了。并且,在这一句,老章写的的【比较】关系(“相反”也是一种比较关系)。Time going to the mid-year, the city’s temperature falls, and the lowest point is 15 degrees. 这一句是用的线性【变化】的思路写的。接下来,老章又回到了写【比较】的思路: The warmest months are January, February, November and December, all of whichsee the average temperature of 25 degrees. 接下来的扫操作是,老章一句话就把表格写完了:With regard to the annual length of sunshine, the sun shines roughly 2500 hours in New York and Sydney and, by stark contrast, less than 1200 hours in London.
* 第 一个划线处,状语从句在主语后插入到主句当中。
* 第二个划线处,这个句子可以当成套句记忆,意思是“情况正相反”。
* 第三个划线处,独立主格结构作状语。
* 第四个划线处,注意定语从句的用法。
# Conclusion
In light of the above, there is, in the tendency of temperature over a year, apparent variance between cities in different hemispheres.
* 如果在总述图表情况的时候,发现其中一个图表的总述不好写,就不写,也可以,不用纠结。

